Performance Audit and Traffic Quality Analysis for a Sportswear Store
Client Overview
A sportswear store specializing in branded sneakers. The company runs its own advertising campaigns and also sells products through dropshipping to niche retailers.
Project Overview
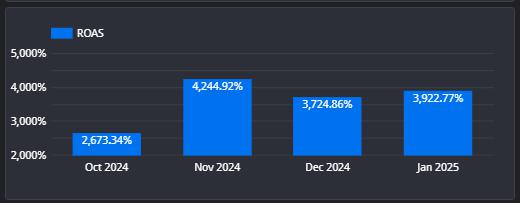
The client requested an audit due to concerns about click fraud, as sales revenue had significantly declined. At the time of inquiry, the ROAS was approximately 2500%, while the target ROAS was 3600%.
Duration
3 months
Primary KPIs
- Accurate analytics setup
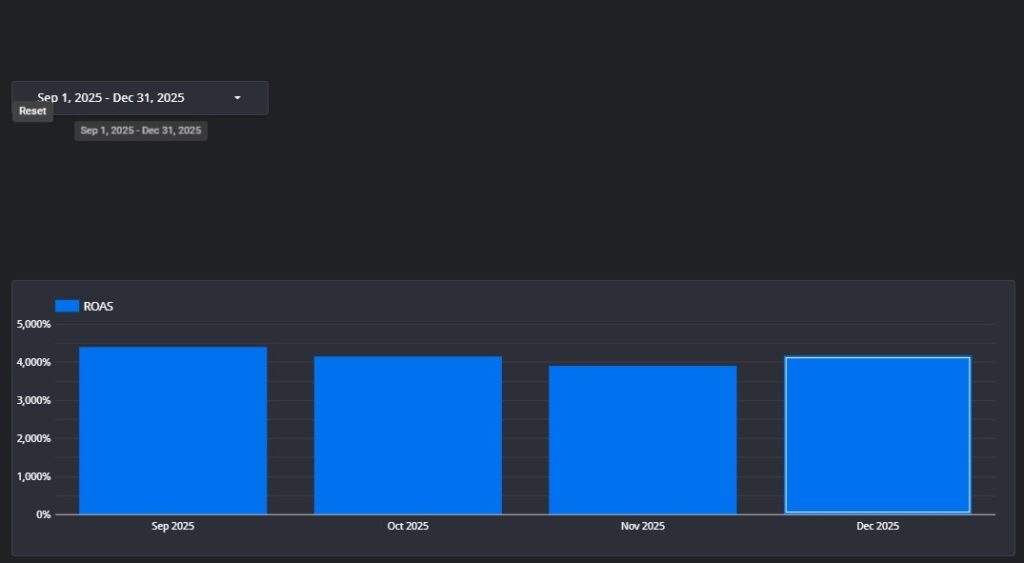
- ROAS: 3600%+
Primary Advertising Channels
- Google Ads (main channel)
- Facebook Ads (used only for remarketing campaigns)
- Email Marketing (used sporadically for Black Friday and pre-holiday sales)
CHALLENGES
- Identifying potential click fraud
- Understanding the reasons behind declining sales
- Fixing existing issues in analytics
- Creating a structured and controlled advertising account aligned with the business model
Strategic and Tactical Actions
Click Fraud Detection and Analytics Setup
Click fraud detection, analytics configuration, and overall data accuracy formed an interconnected problem that required a comprehensive approach:
- Session Tracking in GA4: Set up session tracking in Google Analytics 4 to measure “engaged users,” considering users who stayed on the site for more than 40 seconds.
- Key Event Setup: Ensure that key events truly reflect business value, such as purchase events or call tracking.
- Looker Studio Dashboard: Create a dashboard to track engagement metrics, session duration, pages per session, and events per user.
- Microsoft Clarity Implementation: Use Microsoft Clarity to analyze user behavior on the website.
Investigating the Decline in Sales
- Sales statistics were analyzed by channel.
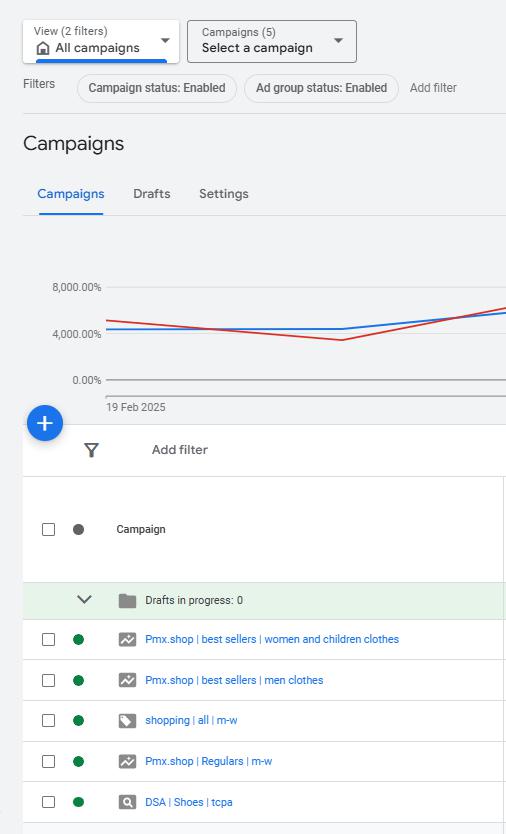
- The account had two active campaigns: PMax and Shopping.
- The PMax campaign included all products without segmentation by category or price. A script automatically marked underperforming products every 30 days, removing them from PMax and moving them to the Shopping campaign with a lower CPC bid.
Key issue: The script did not consider the store’s constantly changing inventory.
- New products were frequently added but did not receive enough clicks to be flagged for Shopping.
- This made the automation ineffective.
Click Fraud Analysis Process
- If engagement rate <50%, immediately analyze user behavior.
- Low engagement may indicate website issues or basic click fraud from competitors.
- If engagement rate >50%, analyze:
- Average session duration per user
- Number of events per user
- These metrics should be evaluated relative to historical data.
- Anomalies are best identified through dynamic analysis rather than absolute benchmarks.
Analytics Issues and Fixes
- The biggest issue: duplicate sales data in Google Ads (each sale triggered two conversions).
- Missing configurations:
- Session duration tracking
- Audience segmentation
- Advanced data collection
- Dynamic remarketing


